
Two transient states have no internal transitions. Their exit rates are \(1\) and \(2\), their initial masses are both \(1/2\), and the two states exit by distinct causes. Thus
with cause densities \(f_1(t)=e^{-t}/2\) and \(f_2(t)=e^{-2t}\).
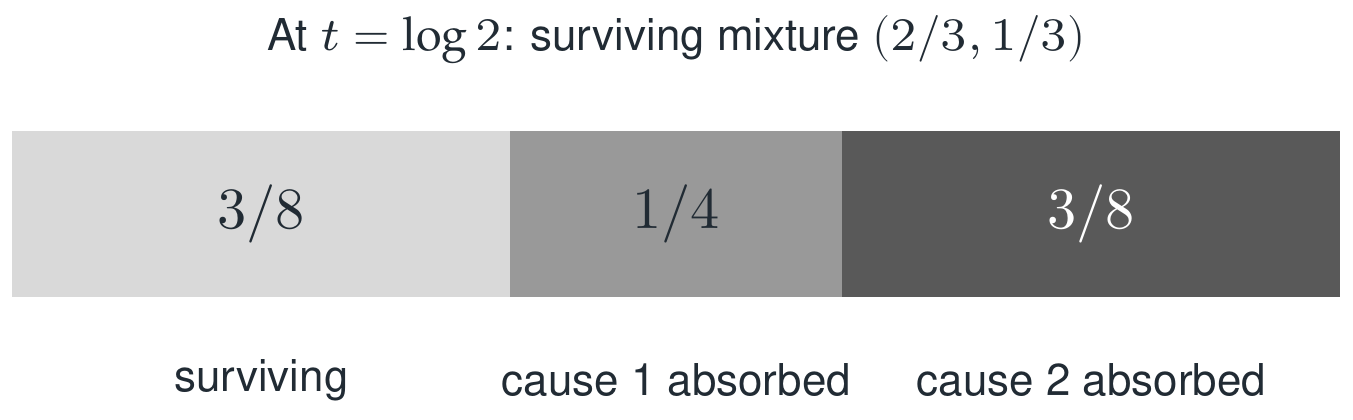
Reading the drawing
The three adjacent segments give the surviving mass and the two cumulative absorbed masses at the displayed time. The note above states the mixture among survivors. The labels distinguish that mixture from the cumulative cause totals.
Drawing labels and data 7 labels
Read the original labels as selectable text. Tables preserve grid relationships; other short labels are grouped compactly.
- \(3/8\)
- \(1/4\)
- \(3/8\)
- surviving
- cause 1 absorbed
- cause 2 absorbed
- At \(t=\log2\): surviving mixture \((2/3,1/3)\)
Evidence note from the source edition
At \(t=\log2\), surviving mass is \(3/8\). Cause 1 has accumulated probability \(1/4\) and cause 2 has accumulated probability \(3/8\); the three pieces sum to one.
Condition on survival before restarting the clock
At this time the transient masses are \((1/4,1/8)\), so the conditional distribution of survivors is \((2/3,1/3)\). Consequently
The original mean lifetime was \(\tfrac12\cdot1+\tfrac12\cdot\tfrac12=3/4\). Surviving longer changes the mixture toward the slower state; it does not restart the original mixture.
The cause densities at \(t=\log2\) both equal \(1/4\), so the cause-specific hazards are both \(2/3\) and total hazard is \(4/3\). Hazards are rates and need not lie in \([0,1]\). Each eventual cause probability is \(1/2\), obtained by integrating its density. Stability of the subgenerator is part of that eventual-absorption statement.
Read this as
Residual life restarts the same transient semigroup from the conditional surviving distribution. Cause probabilities, densities, and hazards answer different questions.