
For the running signal, Haar analysis gives
The plot scales both channels by \(\sqrt2\) so that all displayed ordinates are rational.
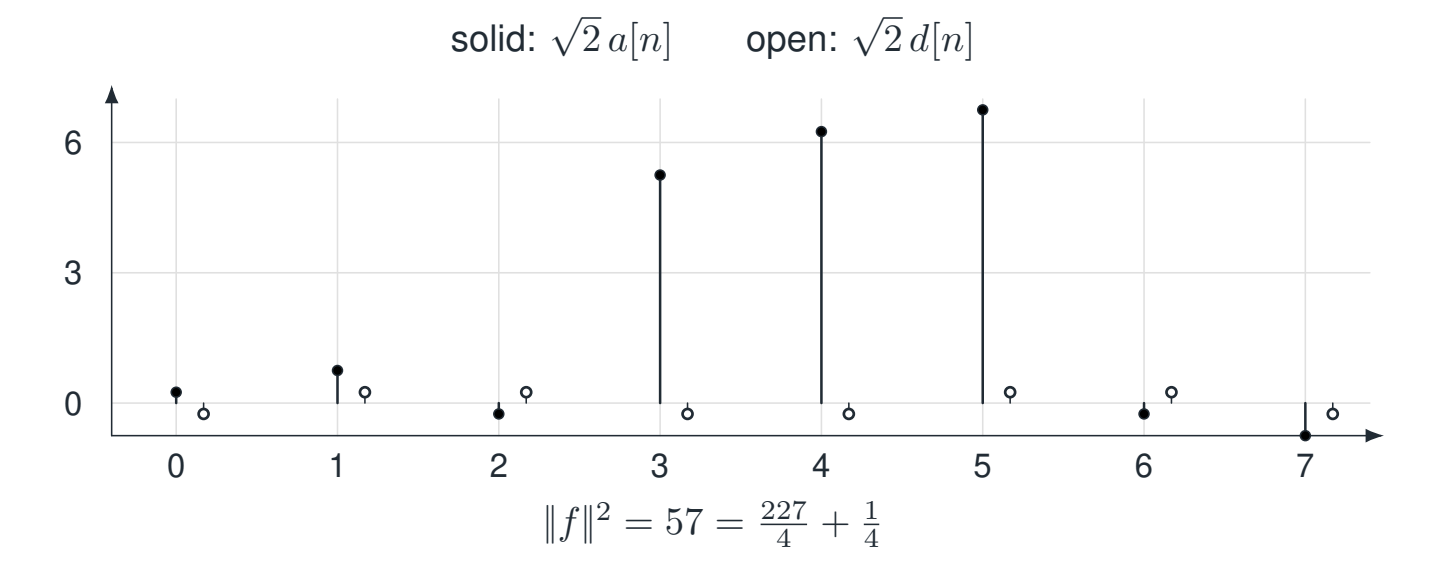
Reading the drawing
The horizontal axis is the channel index. Filled stems are scaled averages and open stems are scaled differences. The displayed energy identity accounts for both channels.
Drawing labels and data 13 labels
Read the original labels as selectable text. Tables preserve grid relationships; other short labels are grouped compactly.
- 0
- 1
- 2
- 3
- 4
- 5
- 6
- 7
- 0
- 3
- 6
- solid: \(\sqrt2\,a[n]\) open: \(\sqrt2\,d[n]\)
\(\|f\|^2=57=\frac{227}{4}+\frac14\)
The exact energy calculation
The low channel has energy \(227/4\), and the detail channel has energy \(1/4\). Their sum is \(57\), exactly the input energy. The normalization is essential: unnormalized sums and differences would multiply the total energy by two.
Why is the first detail channel so small?
The jump starts at sample \(6\) and ends just before sample \(12\). Both lie between the pairs \((0,1),(2,3),\ldots,(14,15)\). Inside every pair the jump contributes either \((0,0)\) or \((3,3)\), so its first-level difference is zero. The small detail values come entirely from the discrete background. This does not mean the edge is absent from the transform. The next split of the low channel compares neighboring pairs, and those comparisons do cross the jump. The next pages expose that contribution explicitly.
Read this as
Haar energy is exact, but a particular detail level is not a universal edge detector. Edge visibility depends on alignment, scale, and the chosen packets.