
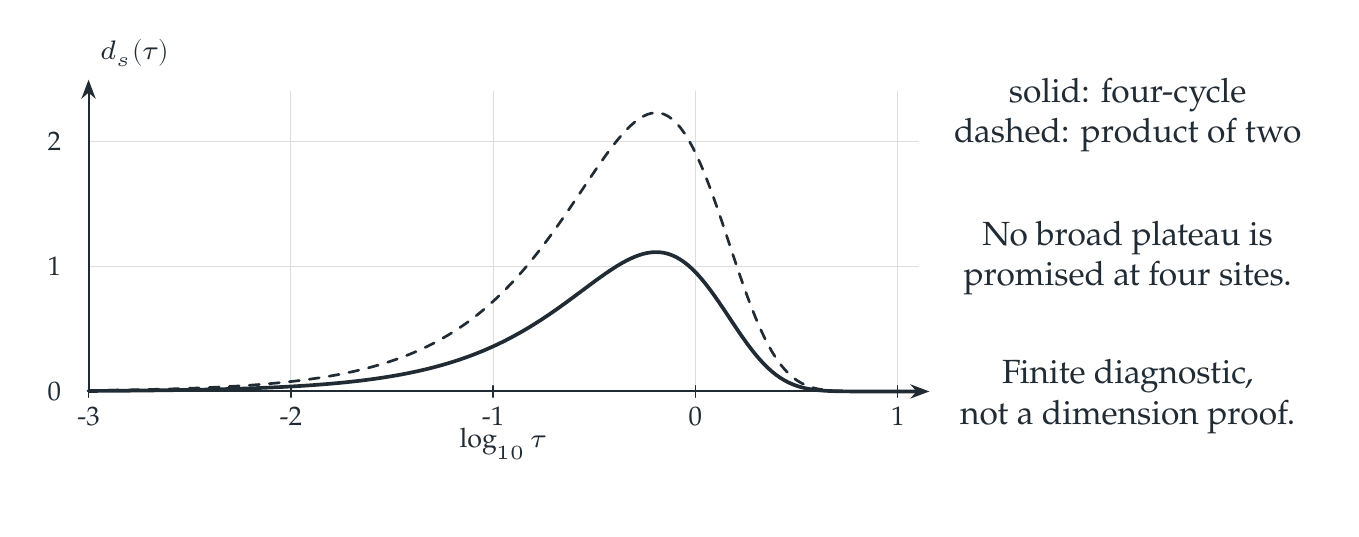
For the Laplacian on a cycle with four sites \(L=2I-S-S^*\), the eigenvalues are \(0,2,2,4\). The normalized heat trace and its diagnostic of spectral dimension are therefore
No numerical differentiation is needed for this finite example.
Reading the drawing
The horizontal axis is logarithmic diffusion time. The solid curve represents the four-cycle and the dashed curve its two-factor product. The notes identify the curves as finite diagnostics and state the limitation on a dimension plateau.
Drawing labels and data 13 labels
Read the original labels as selectable text. Tables preserve grid relationships; other short labels are grouped compactly.
- -3
- -2
- -1
- 0
- 1
- 0
- 1
- 2
- \(\log_{10}\tau\)
- \(d_s(\tau)\)
solid: four-cycle
dashed: product of two
No broad plateau is
promised at four sites.
Finite diagnostic,
not a dimension proof.
Both ends reflect the finite size of the system
As \(\tau\to0\), every eigenmode contributes approximately one and the dimension diagnostic tends to zero. As \(\tau\to\infty\), the zero mode dominates, so it again tends to zero. A finite spectrum cannot sustain a nonzero plateau at all scales.
For the Cartesian product of two identical cycles with four sites, the Laplacian eigenvalues add and the heat traces multiply: \(K_2=K^2\). Consequently \(d_{s,2}=2d_s\) exactly. The product identity determines the second curve exactly from the first.
At \(\tau=\log2/2\), the first curve equals \(4\log2/3\). This noninteger value is a spectral quantity that depends on scale, not a claim that the graph has a fractional topological dimension. Four sites are too few to promise a broad geometric plateau. Experiments on larger grids remain finite diagnostics. Convergence requires the analytic hypotheses developed on Visual 37.
Read this as
A convincing continuum dimension needs a stable scale window that persists under controlled refinement. One appealing finite curve is not that theorem.