
Take \(R={\mathbb Z}_3[[t_1,t_2]]\) and coefficient-preserving local maps to \({\mathbb Z}/27{\mathbb Z}\). Locality forces both parameters into the maximal ideal. Each therefore has nine possible values, \(0,3,6,\ldots,24\).
Reading the drawing
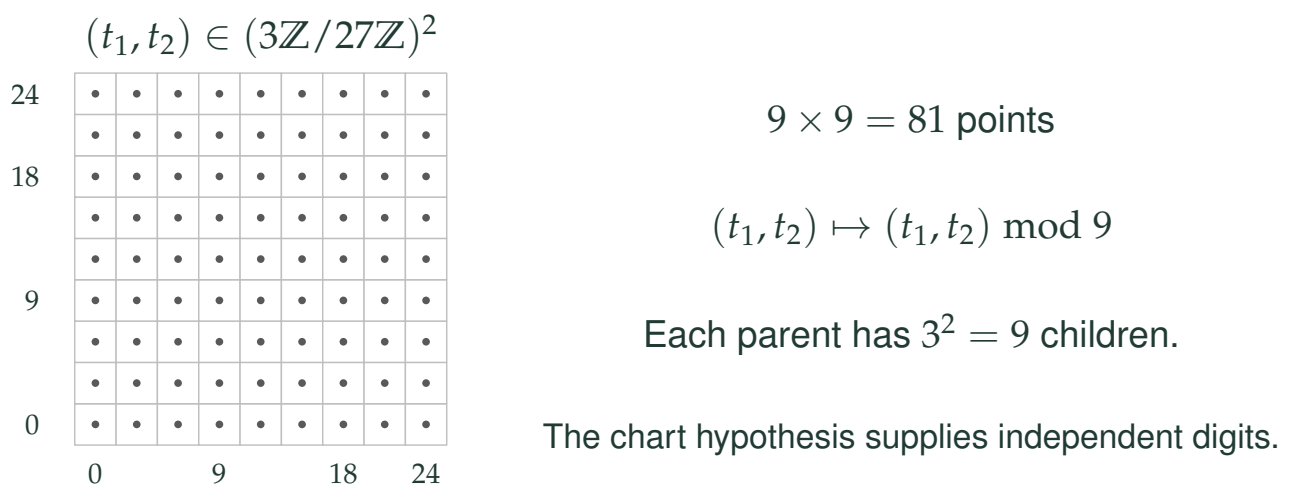
The nine-by-nine grid gives parameter values divisible by three modulo 27. Every point is displayed. The reduction has nine children above each parent because both parameters are independent in this particular power-series chart.
Drawing labels and data 13 labels
Read the original labels as selectable text. Tables preserve grid relationships; other short labels are grouped compactly.
- \(0\)
- \(0\)
- \(9\)
- \(9\)
- \(18\)
- \(18\)
- \(24\)
- \(24\)
\((t_1,t_2)\in(3\mathbb Z/27\mathbb Z)^2\)
- \(9\times9=81\) points
- \((t_1,t_2)\mapsto(t_1,t_2)\bmod9\)
- Each parent has \(3^2=9\) children.
The chart hypothesis supplies independent digits.
Why the exponent is \(d(m-1)\)
At depth \(m\), the image of the maximal ideal contains \(3^{m-1}\) elements. Two independent parameters give \(3^{2(m-1)}\) points. The grid displays all \(81\) points at depth three, not a random sample. Reduction to depth two maps each coordinate to one of \(0,3,6\), and every parent has nine children.
Counting all \(27^2\) parameter assignments at depth three would ignore locality. Counting only tangent directions would describe the first layer but not all later layers. The power-series presentation explains why these choices stay independent through every precision.
This is a coordinate model with a proved presentation. A general deformation ring can impose equations among the parameters, changing the counts and causing branches to die. The next pages retain the same depth convention while changing the allowed coordinates or adding a singular equation.
Read this as
The smooth count is not a universal rule for deformation spaces. Its independence comes from the actual formal power-series chart.