
Smith normal form concerns linear congruences. The Smith impedance chart uses the nonlinear coordinate change
They share a name, not a mathematical definition. Sample the reflection circle at the exact algebraic points \(\Gamma_k=\tfrac12 e^{ik\pi/4}\).
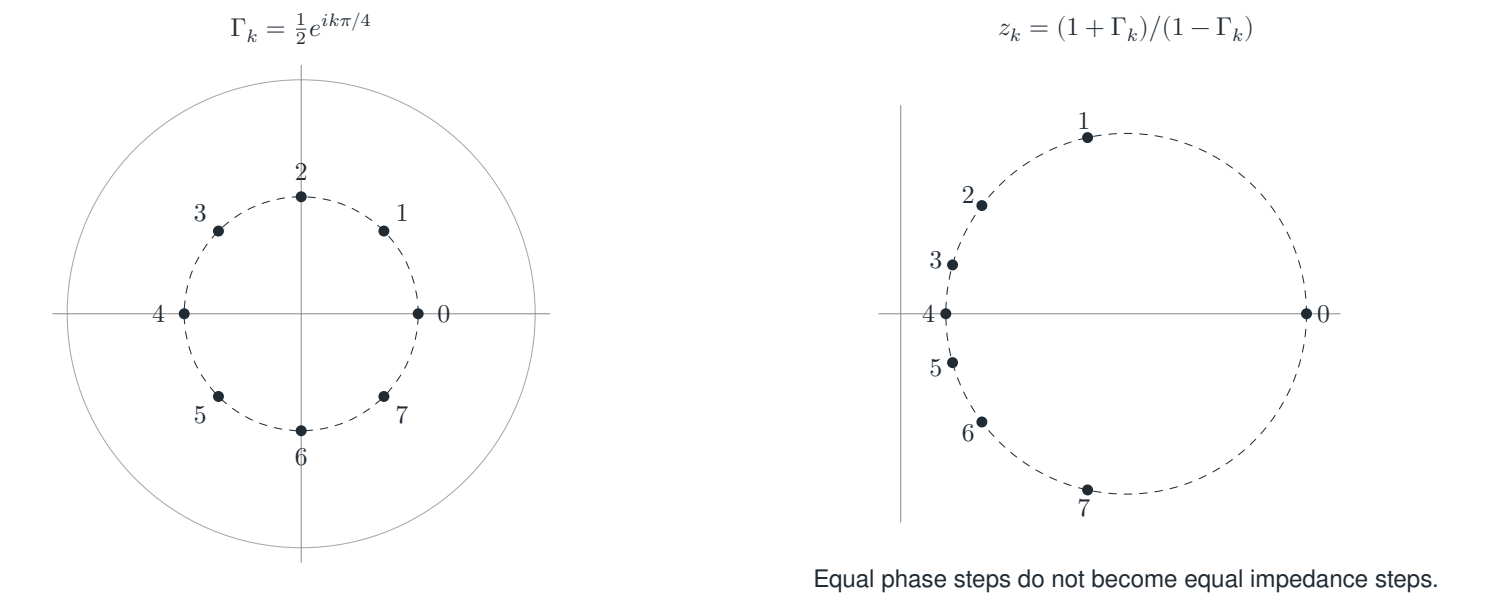
Reading the drawing
Matching labels refer to the same algebraically computed point in two charts. The outer circle marks the unit boundary rather than an additional sampled orbit.
Drawing labels and data 19 labels
Read the original labels as selectable text. Tables preserve grid relationships; other short labels are grouped compactly.
\(\Gamma_k=\frac12e^{ik\pi/4}\)
- \(0\)
- \(1\)
- \(2\)
- \(3\)
- \(4\)
- \(5\)
- \(6\)
- \(7\)
- \(z_k=(1+\Gamma_k)/(1-\Gamma_k)\)
- \(0\)
- \(1\)
- \(2\)
- \(3\)
- \(4\)
- \(5\)
- \(6\)
- \(7\)
Equal phase steps do not become equal impedance steps.
Evidence note from the source edition
Matching labels identify the same point in the two coordinates. All eight points are computed algebraically. Only their placement on the page is rendered numerically. The outer left circle is \(|\Gamma|=1\), not part of the sampled radius-\(1/2\) orbit.
The half-turn \(\Gamma\mapsto-\Gamma\) gives
Thus the labels \(0\) and \(4\) are \(3\) and \(1/3\). Label \(2\) is \((3+4i)/5\), and the opposite point is its reciprocal. The domain restrictions come from the forward and inverse coordinate denominators.
These sampled phase points are not linear idempotent ranges. Refining from two to four to eight samples inserts more points on the same orbit. This does not imply a linear packet decomposition of impedance values.
Read this as
The chart is a geometric realization of phase action. Its nonlinear coordinate sensitivity near \(\Gamma=\pm1\) is not the Smith congruence-fiber count and not a new linear projector theorem.