
Write the signed denominator as a finite exponential sum:
For \(z=re^{i\theta}\), the size of one exponential is \(e^{r\Re(\eta e^{i\theta})}\). The maximal projection determines the directional exponential growth.
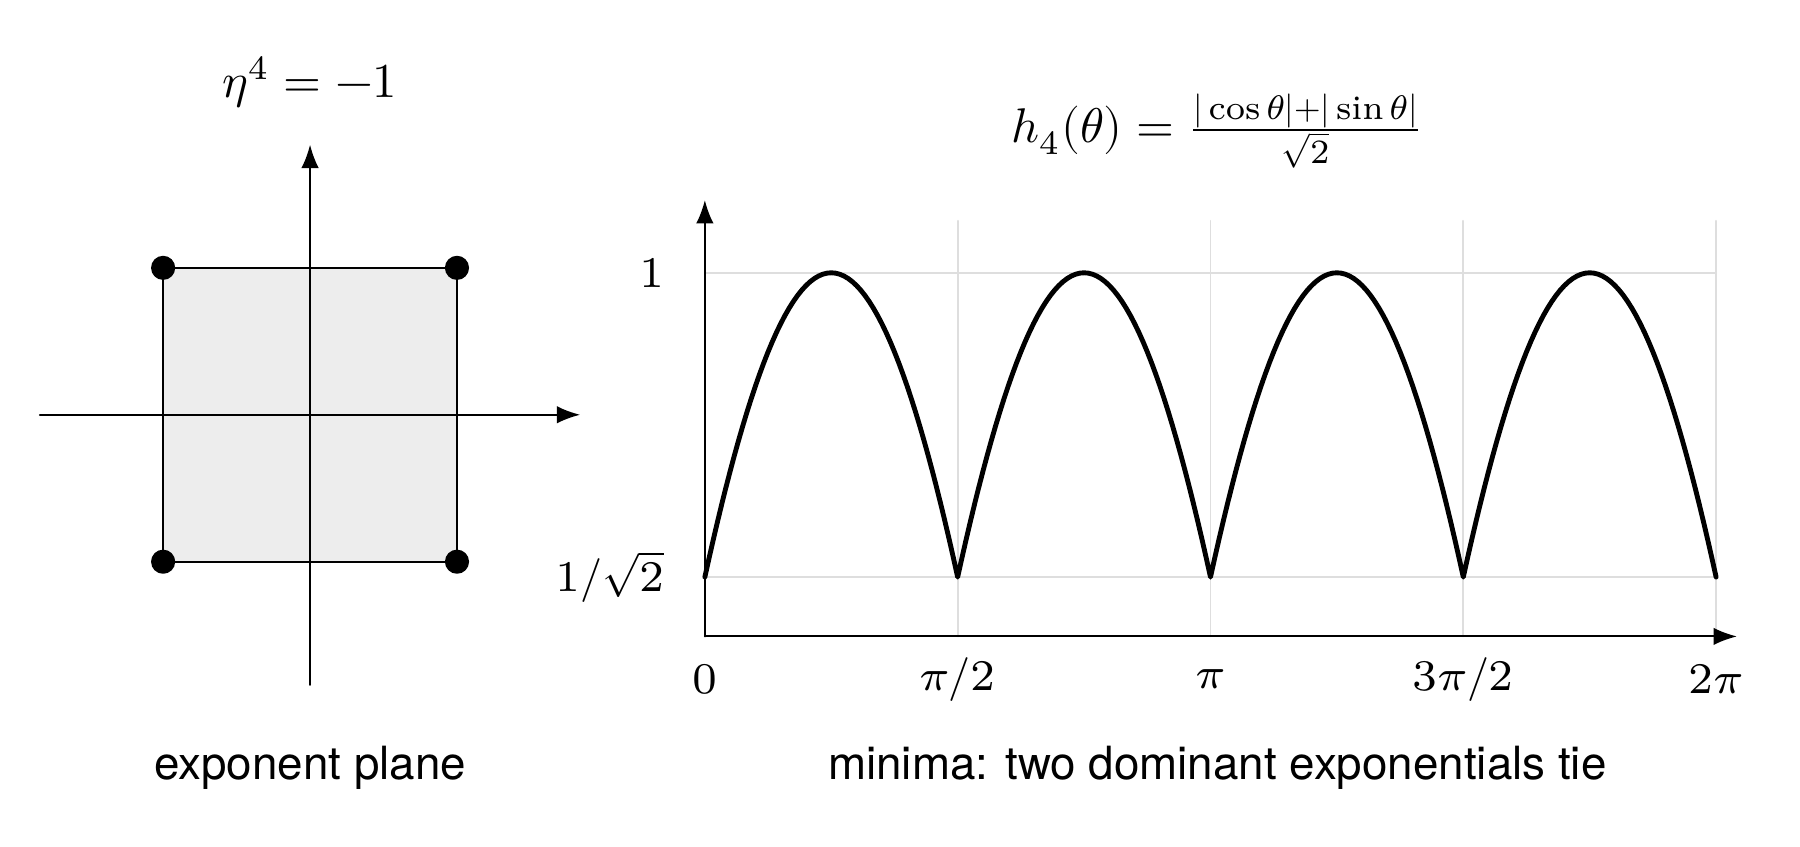
Reading the drawing
The left panel is the square of exponent roots in the complex plane. The right panel plots the corresponding support-function formula against angle. Its four minima occur at the coordinate-ray angles, where adjacent dominant exponentials tie. The curve describes directional growth through a limsup; it does not remove the cancellations or zeros possible along those rays.
Drawing labels and data 11 labels
Read the original labels as selectable text. Tables preserve grid relationships; other short labels are grouped compactly.
Exponent polygon
- \(\eta^4=-1\)
- exponent plane
Angular-axis ticks
\(0\), \(\pi/2\), \(\pi\), \(3\pi/2\), \(2\pi\)
Indicator-axis ticks
\(1/\sqrt2\), \(1\)
- minima: two dominant exponentials tie
The indicator is
Away from a tie direction, one exponential dominates all the others by a uniform positive projection gap on compact angular sets. For sufficiently large radius, smaller terms cannot cancel it. Those sectors are eventually zero-free.
Why zeros remain possible on a growing ray
At a tie, two adjacent exponents have the same real projection. Their complex phases can be opposite. Their sum can therefore vanish even though each term is exponentially large. The minima in the order-four indicator plot occur precisely at the tie directions \(\theta=k\pi/2\). The indicator uses a limsup in radius. It does not assert that \(r^{-1}\log|D_N(re^{i\theta})|\) has an ordinary limit through the zeros on a tie ray.
Read this as
The polygon predicts where large cancellation is possible. It does not, by itself, enumerate zeros or prove their simplicity.
Evidence note from the source edition
The order-four polygon and support-function formula are explicit. The curve is a sampled display of that formula. Eventual localization and uniqueness require the separate zero-analysis arguments.